Account Sharing Report
In yesterday’s announcement about hourly operator activity, I promised more reports. This is the first:
This shows the accounts that are the most likely to be either sharing credentials or are being used in some automated fashion. There is some math and statistical analysis involved; the details are on the page itself.
Clearly, account sharing is hugely problematic not only for CJIS compliance, but also for general auditability and accountability. The levels of use that we’re seeing for some accounts indicates to some degree of statistical certainty that this isn’t Chief Wiggum borrowing an account from Officer Eddie for the day.
But wait, there’s more!
Search Anomaly Index (SAI)
A Search Anomaly Index (SAI) is now indicated with every result.
This composite index tells you how “anomalous” a search is; i.e., how much it deviates from an operator’s typical patterns. We analyze operators’ typical work hours, search volumes, and scopes. Anything that deviates from that baseline is assigned a score.
| Score Range | Classification | Meaning | Rationale |
|---|---|---|---|
| < 1.75 | Normal 🟢 | In-shift; typical patterns | Minimal deviation |
| 1.75 – 5.0 | Elevated ⚠️ | In-shift; unusual burst | Z-score deviation |
| 5.0 – 8.0 | Anomaly 🟠 | Out-of-shift; moderate | 5× temporal penalty |
| ≥ 8.0 | Critical 🔴 | Out-of-shift; irregular | High combined risk |
The technical explanation is below, but it’s easier to just show you. Here’s a “normal” search:
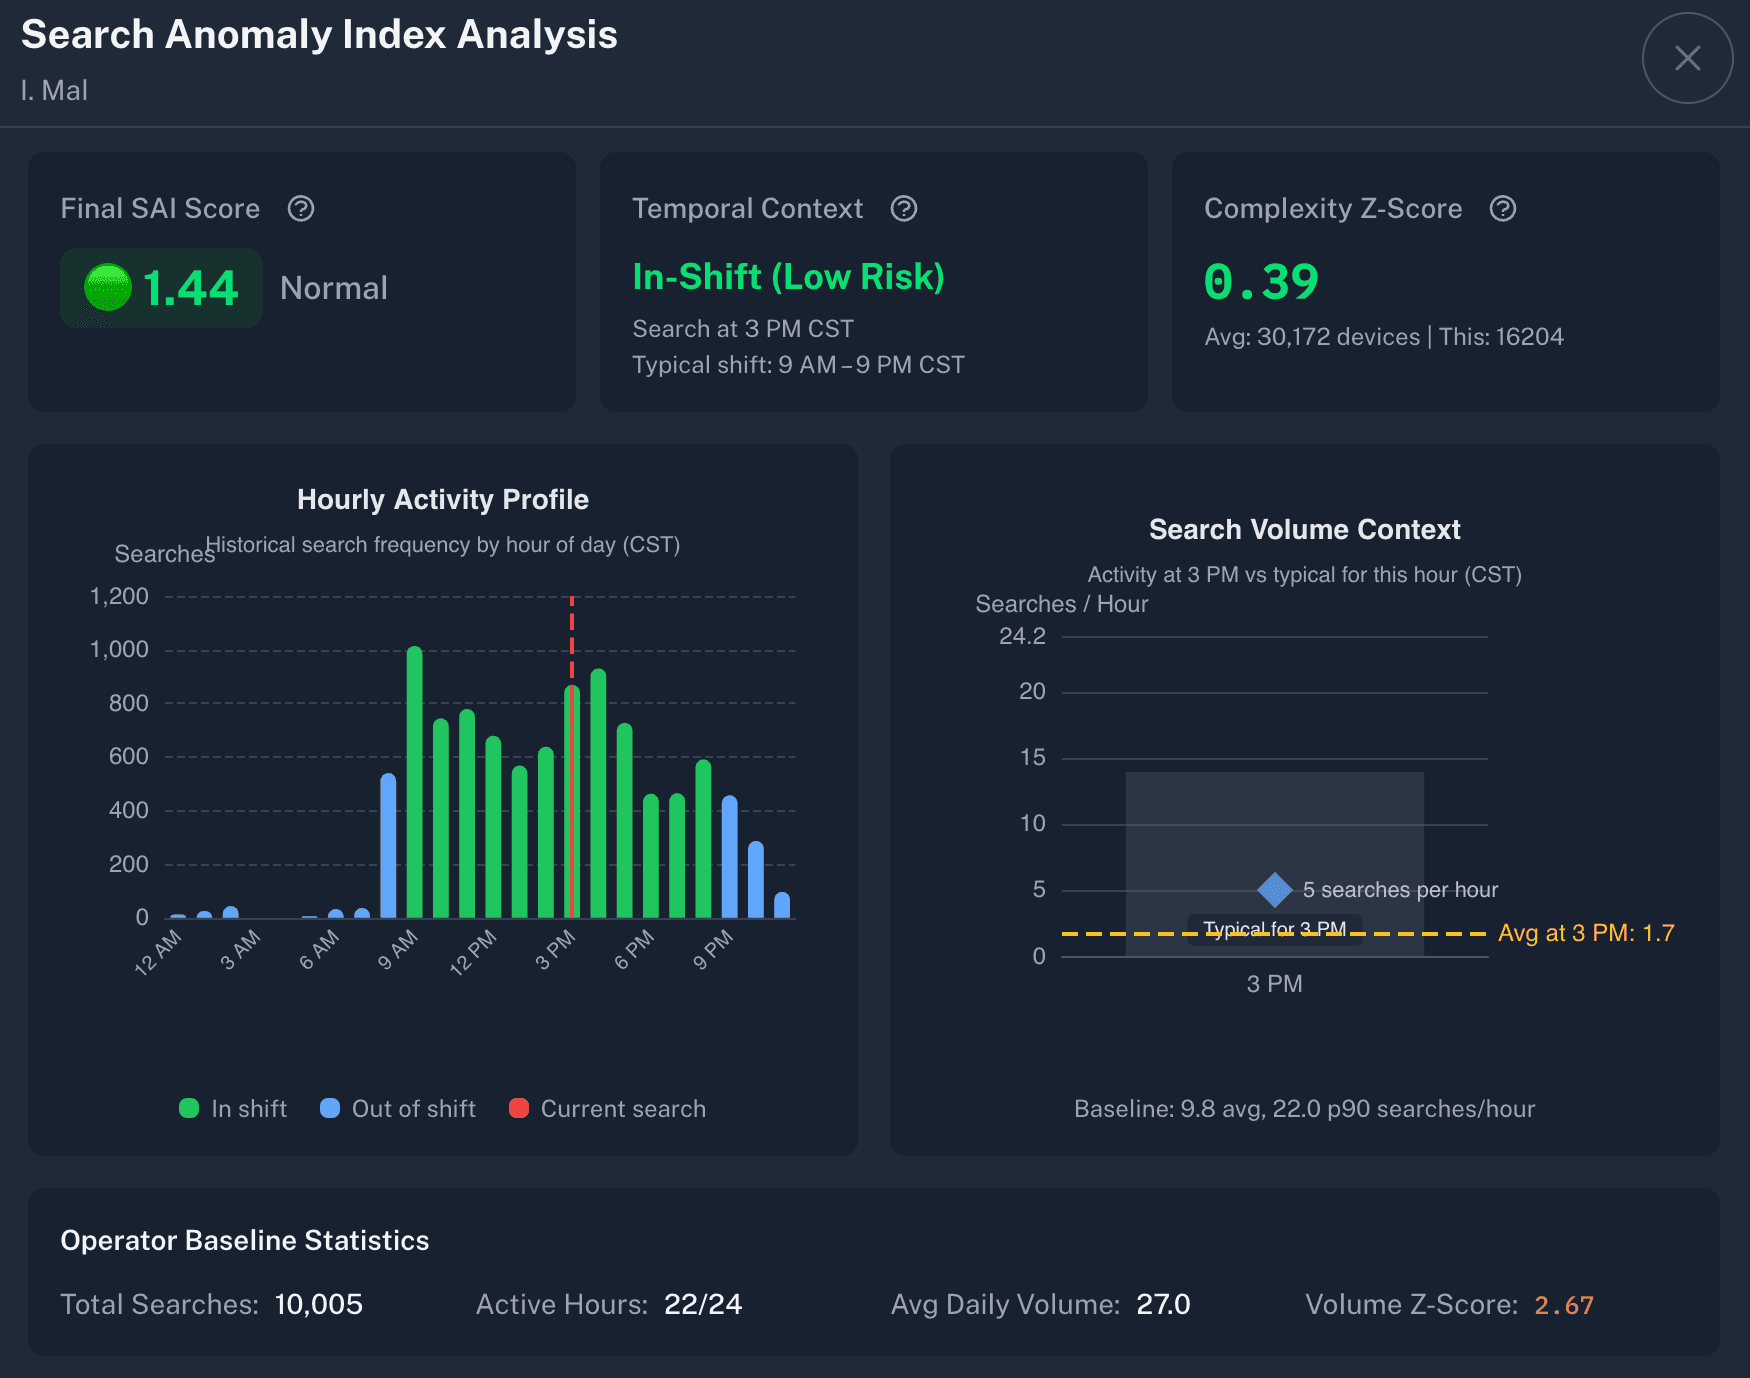
This search shows a user who is typically most active 9am – 9pm, performing a search at 3pm. They typically conduct about 5 warantless searches per hour around 3pm; in the hour around this search, they conducted 5.
Compare that to this high-SAI search from the same user:
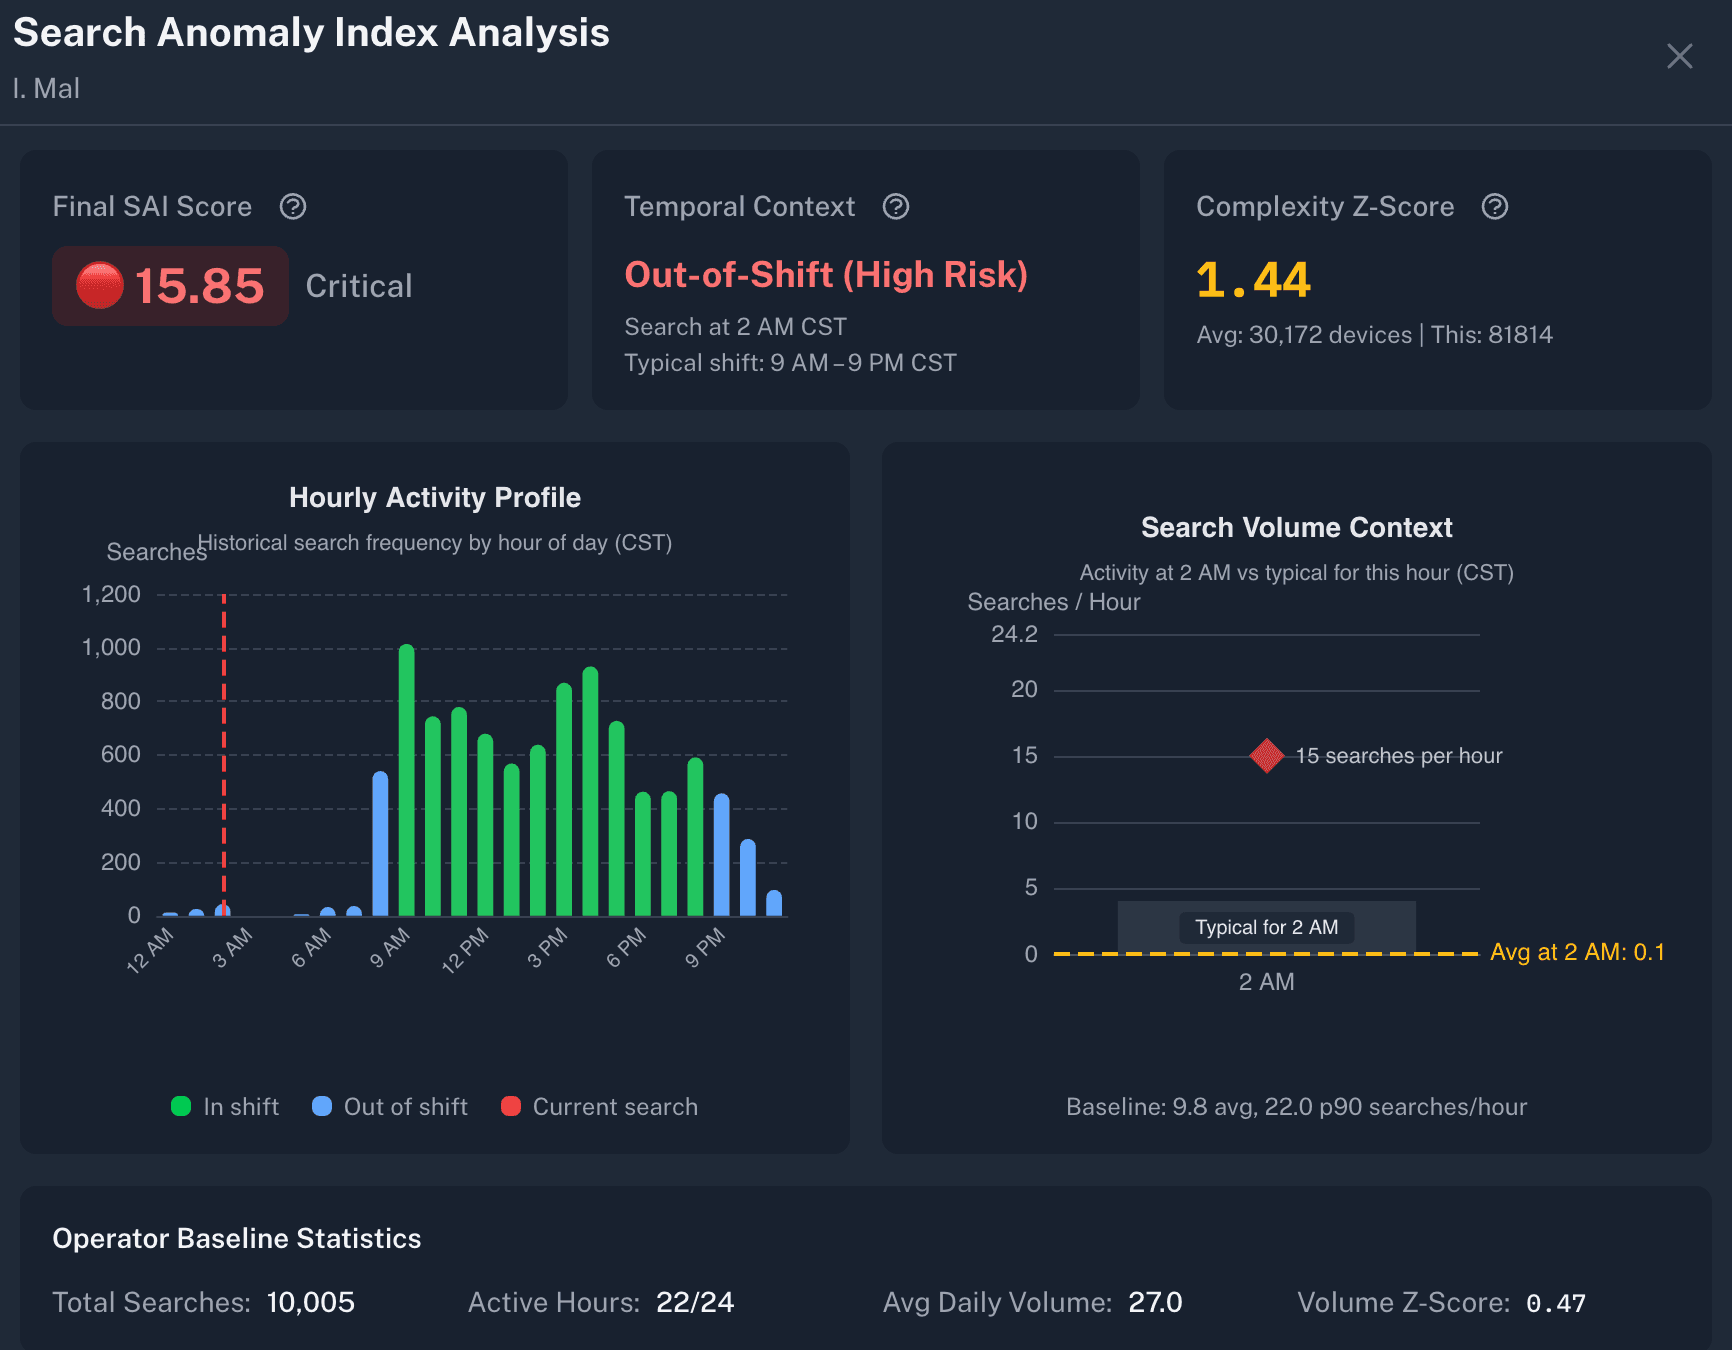
This search was conducted at 2am. Their normal pattern shows virtually no activity at this time, with 0.1 searches between 2am – 3am on average.
According to the data, a University of Iowa detective working the day shift was up at 2am doing ~15 searches per hour, investigating a moving violation on behalf of Iowa City — a city that banned ALPRs.
The SAI indicates that is statistically less likely that this search falls within the scope of his regular duties.
For the nitty gritty, here is the current algorithm. SAI values may change as the algorithm is further tuned and refined. As always: check with the sources and do your own math before drawing any hard conclusions.
Primary Active Window
The first component is temporal: the system calculates the operator’s Primary Active Window (PAW), which is the dynamic, statistically determined continuous block of hours (e.g., 10 or 12 hours) that accounts for 85% of the operator’s total historical search activity. “Out of shift” searches receive a penalty.
Intensity Deviation
The second is the Intensity Deviation; this measures how far the current search characteristics are from the operator’s established average behavior. We use the Standard Z-Score to calculate this distance. A Z-score measures deviation in terms of Standard Deviations ().
Intensity Deviation is based on:
1. Volume Contribution (Bursts of Activity)
This measures if the operator is performing searches at an unusually high or low rate during the hour the search occurred.
- Current Value: The total number of searches performed by this operator in the current 60-minute window ().
- Baseline ( & ): The operator’s historical average search volume for that specific hour of day (e.g., “at 3pm, this operator typically does X searches”) and its variability (). This hour-specific baseline is more accurate than an overall average because operators often have predictable daily patterns.
- Calculation: (weighted contribution).
2. Complexity Contribution (Scope of Search)
This measures if the search scope (the data accessed) is unusual for the operator.
- Current Value: The total number of devices searched ().
- Baseline ( & ): The operator’s historical average device search count (excluding records with zero devices for accuracy) and its variability.
- Calculation: (weighted contribution).
3. Zero-Baseline Override
If an operator has no historical activity for a particular hour of the day — they’ve simply never searched at, say, 3am before — and then they do, the system assigns a fixed high Z-score of 10.0. First-time activity during an unusual hour is inherently anomalous.
4. Low-Volume Gate
To prevent false positives from sparse baselines (e.g., an average of 0.2 searches/hour), the system suppresses Z-score calculations when the current hourly count is 5 or fewer. A handful of searches at an unusual time is not statistically significant.
5. Org-Level Median Fallback
When an operator has incomplete baseline data (e.g., no historical device search statistics), the system falls back to organization-level median values. This prevents extreme z-scores for new operators or those with sparse data.
- If
avg_devices_searchedis NULL, the system uses the median device count across all operators in the same organization - Critically, when using org defaults, both mean and standard deviation are taken from the org median — mixing the org’s mean with an operator’s tiny stddev would produce extreme scores
- This ensures new operators are compared against reasonable organizational norms rather than defaulting to zero (which would flag any search as massively anomalous)
Final Score Calculation
The SAI score combines these components:
The Context Multiplier is 5.0 for out-of-shift searches and 1.0 otherwise.
Baselines
To establish baselines, the following metrics are stored for each operator:
- Temporal Baseline: The
paw_start_hourand the dynamicpaw_duration_hrs(the minimum number of hours needed to capture 85% of their total activity). - Hourly Volume Baseline ( & ): For each hour of the day (0-23), the mean and standard deviation of search counts. This captures patterns like “Officer Smith typically does 5-10 searches at 2pm but only 1-2 at 8pm.”
- Complexity Baseline ( & ): The mean and standard deviation for device search counts (excluding records with zero devices for accuracy).